Double logistic function
double_logistic.RdDouble logistic function have two periods each with a logistic shape, either one of them will be decreasing and the other increases.
double_logistic(
  x = seq(0, 10, 0.01),
  bound1 = 0,
  bound2 = 1,
  rate1 = 2,
  rate2 = 5,
  midpoint1 = 3,
  midpoint2 = 7
)
Arguments
- x
time horizon
- bound1
the boundary of function (this will equals the function value at time zero)
- bound2
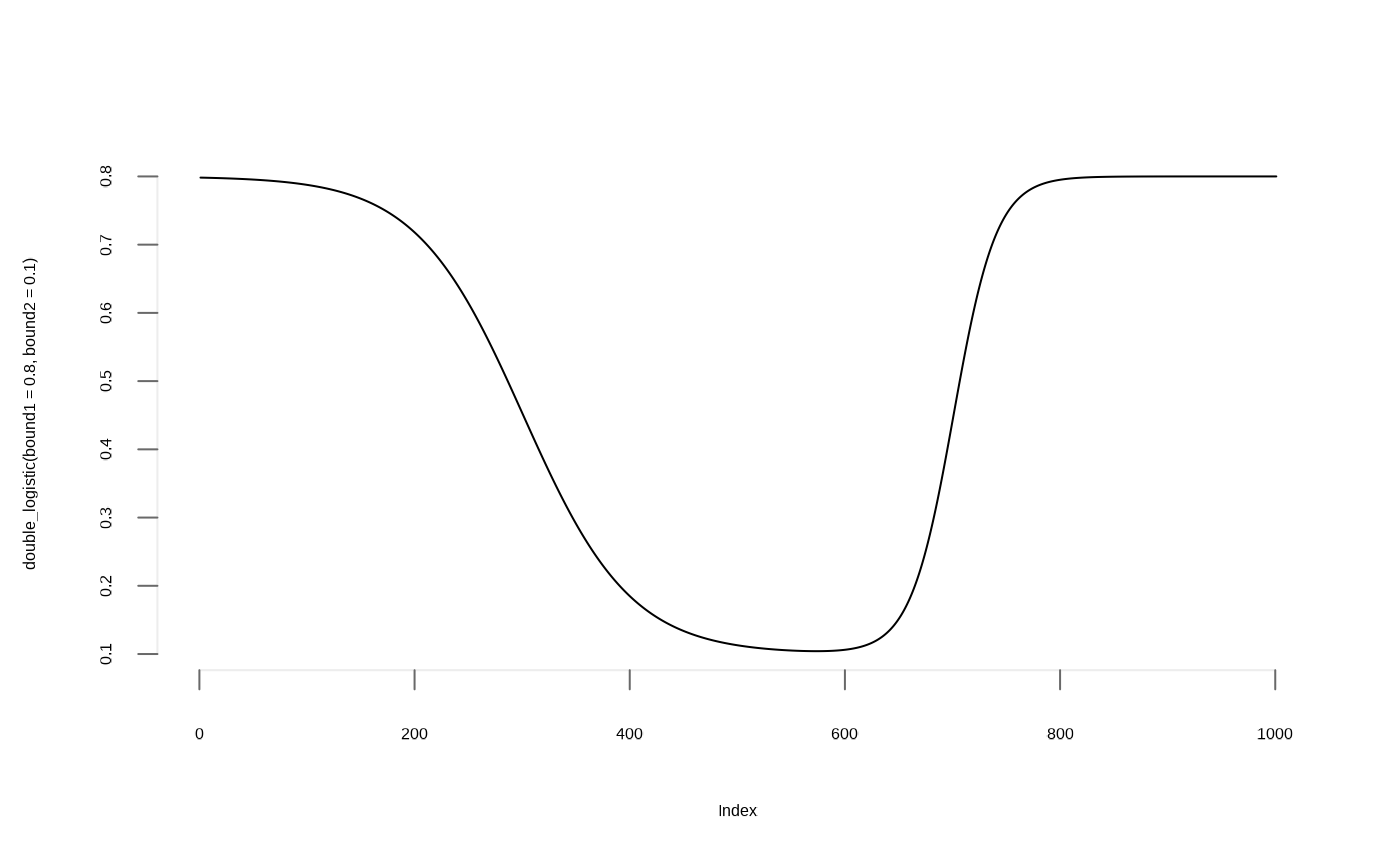
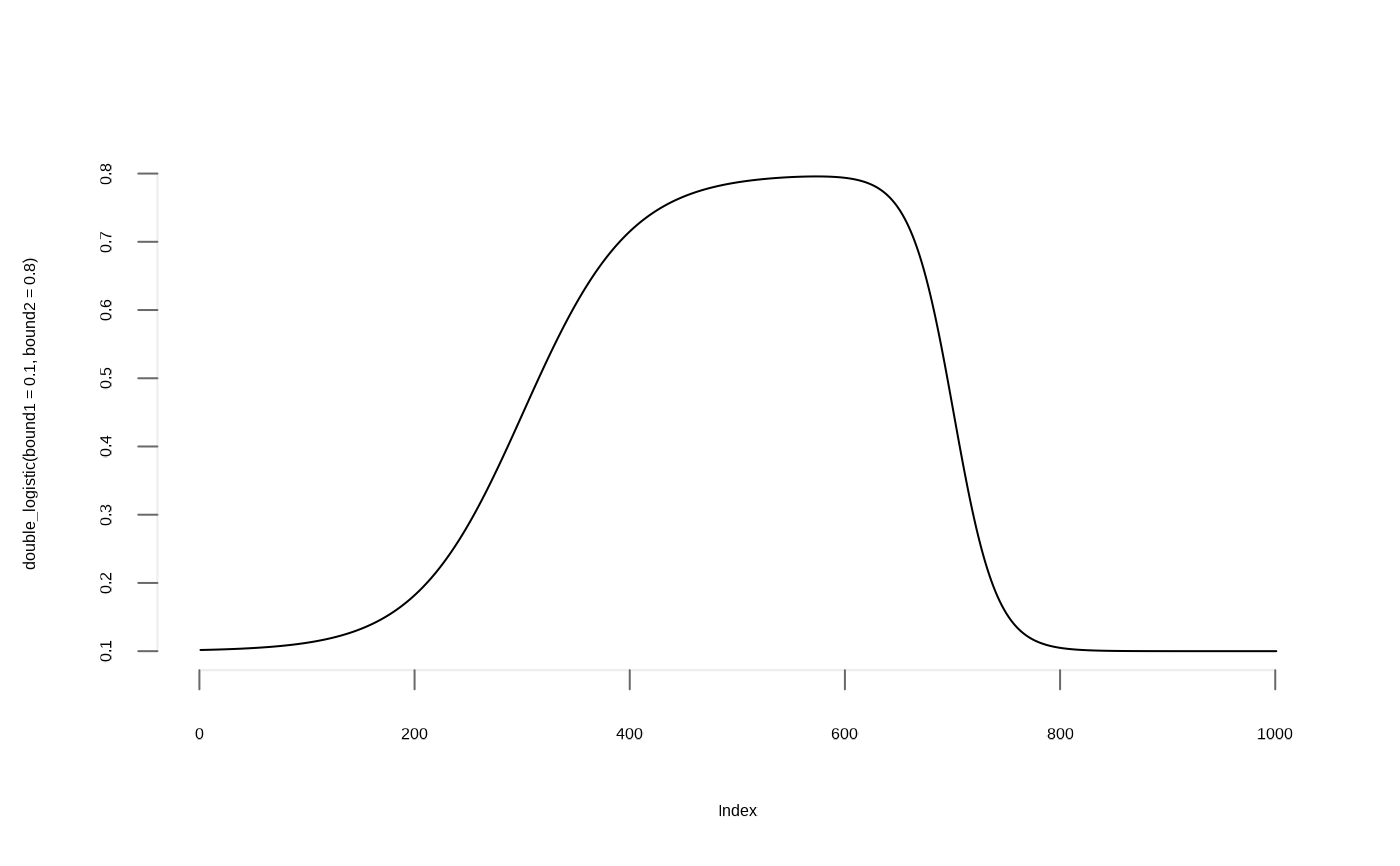
the second boundary, if bound1 > bound2 the function increase first then decrease, and vice versa.
- rate1
rate of change of first period, control the sharpness of changes
- rate2
rate of change of second period, control the sharpness of changes
- midpoint1
midpoint where the chance occurs in the first period
- midpoint2
midpoint where the chance occurs in the second period
Value
vector of length x
See also
Examples
plotl(double_logistic(bound1=0.1, bound2=0.8))

plotl(double_logistic(bound1=0.8, bound2=0.1))